BOM Cost Optimization Strategies for Wireless AP Motherboards
Blog 2026-06-01
BOM Cost Optimization Strategies for Wireless AP Motherboards
Key Overview
Core Issue: How to reduce BOM costs without compromising performance or reliability in wireless AP motherboard design.
Key Conclusions: BOM cost optimization requires a systematic approach across component selection, supplier management, and design optimization. Focus on high-impact areas like SoC and RF front-end. Volume purchasing and strategic sourcing are critical for long-term cost reduction.
BOM (Bill of Materials) cost is a critical factor in wireless AP product competitiveness. Optimizing BOM costs without sacrificing performance or reliability requires a systematic approach across component selection, supplier management, and design optimization. As a core component of how to balance RF performance and cost in wireless AP motherboard development, BOM cost optimization is essential for achieving market success. Why is BOM cost optimization important? What are the major cost drivers? How can you reduce costs without compromising quality? This article provides comprehensive guidance.
Why BOM Cost Optimization Matters
BOM cost optimization is critical for several reasons:
- Market competitiveness: Lower BOM cost allows more competitive pricing, which is essential in the crowded wireless AP market.
- Gross margin improvement: Reducing BOM cost directly increases gross margin without increasing sales price.
- Profitability: Even small percentage reductions in BOM cost can significantly impact overall profitability, especially at high volumes.
- Supply chain resilience: Diversifying suppliers and optimizing component selection improves supply chain flexibility.
- Product lifecycle management: Cost optimization extends product profitability throughout its lifecycle.
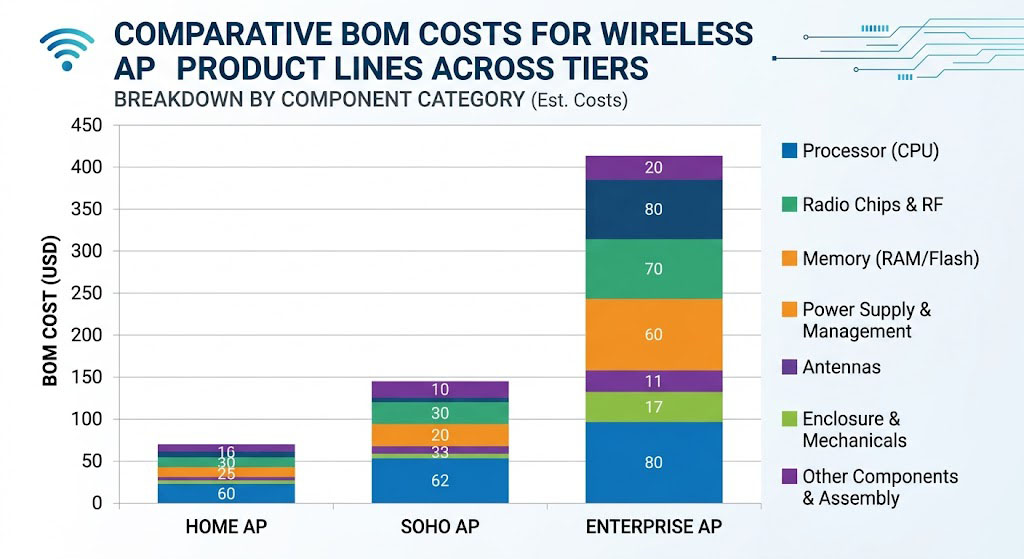
Typical BOM Cost Structure for Wireless APs
Typical BOM cost breakdown for wireless APs:
| Component Category | Percentage of BOM | Key Components |
|---|---|---|
| Wi-Fi SoC/Chipset | 20-30% | Main processor, integrated MAC/PHY/RF |
| RF Front-End | 15-25% | PA, LNA, switches, FEM modules |
| PCB | 10-20% | Board material, layer count, fabrication |
| Memory | 8-15% | DRAM, Flash, eMMC |
| Power Management | 5-10% | PMIC, DC-DC converters, LDOs |
| Antennas | 3-8% | PCB antennas, external antennas |
| Connectors & Interfaces | 3-6% | Ethernet ports, USB, power connectors |
| Passive Components | 2-5% | Capacitors, resistors, inductors |
| Other | 2-5% | Enclosure, heatsink, firmware |
Component-Level Cost Reduction Strategies
Component-level cost reduction strategies:
- SoC Selection: Evaluate trade-offs between integrated features and cost. Consider less integrated but lower-cost options if features aren’t needed.
- RF Front-End Optimization: Compare integrated FEMs vs discrete components. For high-volume products, discrete components may offer better cost.
- Memory Optimization: Use appropriate memory density for the application. Avoid over-specifying memory capacity.
- PCB Optimization: Use minimum layer count that meets requirements. Consider standard FR-4 material unless high-frequency performance requires premium materials.
- Power Management: Select cost-effective PMICs with adequate efficiency. Consider integrated solutions.
- Antenna Selection: Use internal PCB antennas for cost-sensitive applications. Avoid external antennas unless required for performance.
Strategic Sourcing and Supplier Management
Strategic sourcing strategies:
- Supplier Diversification: Work with multiple suppliers to avoid single-source dependencies and improve negotiation leverage.
- Long-Term Contracts: Negotiate volume-based pricing with suppliers through long-term agreements.
- Local Sourcing: Consider local suppliers for reduced logistics costs and faster delivery.
- Supplier Development: Collaborate with suppliers to optimize component design for cost.
- Distributor Relationships: Build relationships with authorized distributors for better pricing and availability.
| Sourcing Strategy | Benefits | Considerations |
|---|---|---|
| Single Supplier | Simplified management, potential volume discounts | Supply chain risk, limited negotiation power |
| Multiple Suppliers | Redundancy, better negotiation leverage | Increased management complexity |
| Long-Term Contract | Price stability, guaranteed supply | Commitment to minimum volumes |
| Local Sourcing | Faster delivery, lower logistics costs | Limited supplier options, potentially higher unit cost |
Design Optimization for Cost Reduction
Design optimization strategies:
- Minimize Component Count: Use integrated components where possible to reduce BOM complexity and cost.
- Standardize Components: Use common components across product lines to leverage volume purchasing.
- Simplify PCB Design: Use fewer layers, standard footprints, and reduce complexity.
- Optimize Manufacturing Process: Design for automated assembly to reduce labor costs.
- Use Standard Interfaces: Avoid proprietary connectors and interfaces that increase cost.
Volume Purchasing and Negotiation
Volume purchasing strategies:
- Consolidate Requirements: Combine requirements across product lines to increase total volume.
- Forecast Accurately: Provide suppliers with accurate volume forecasts to negotiate better pricing.
- Negotiate Tiered Pricing: Establish tiered pricing based on volume thresholds.
- Consider Long-Term Commitments: Offer longer-term commitments in exchange for lower pricing.
- Leverage Group Purchasing: Join industry purchasing consortia for better pricing power.
Cost Reduction vs Quality Trade-offs
Important trade-offs to consider:
- Component Quality: Lower-cost components may have lower reliability or shorter lifespans.
- Performance: Cost reductions may require trade-offs in performance specifications.
- Supply Chain Risk: Lower-cost suppliers may have less reliable delivery or quality control.
- Long-Term Costs: Cheaper components may lead to higher warranty and support costs.
- Regulatory Compliance: Cost-cutting should not compromise regulatory compliance.
| Cost Reduction Measure | Potential Risks | Mitigation Strategies |
|---|---|---|
| Component Substitution | Quality, reliability issues | Thorough qualification testing |
| Simplified PCB | Performance degradation | Careful simulation and testing |
| Lower-Cost Suppliers | Supply chain instability | Supplier qualification, dual sourcing |
| Reduced Component Specs | Performance limitations | Careful requirement analysis |
Implementing a Cost Optimization Process
Implementing a cost optimization process:
- Establish Baseline: Document current BOM costs and identify cost drivers.
- Set Targets: Define cost reduction targets based on market requirements and profitability goals.
- Analyze Opportunities: Evaluate component alternatives, supplier options, and design changes.
- Prioritize Actions: Focus on high-impact opportunities with acceptable risk.
- Implement Changes: Execute cost reduction initiatives with proper testing and validation.
- Monitor Results: Track cost savings and ensure quality is maintained.
- Continuous Improvement: Regularly review and optimize BOM costs throughout the product lifecycle.
Summary
BOM cost optimization is essential for wireless AP competitiveness:
- Focus on high-cost components: SoC, RF front-end, and PCB are the biggest cost drivers.
- Strategic sourcing matters: Supplier diversification, volume purchasing, and long-term contracts significantly impact costs.
- Design for cost: Minimize component count, standardize parts, and optimize manufacturing.
- Balance cost and quality: Don’t compromise reliability or performance for short-term savings.
- Continuous improvement: Cost optimization is an ongoing process, not a one-time exercise.
As a core component of how to balance RF performance and cost in wireless AP motherboard development, BOM cost optimization must be coordinated with PCB layout, RF front-end selection, and EMC certification to achieve optimal system performance at the right cost.
When evaluating long-term cost strategies, it’s also worth reviewing OEM vs ODM for wireless AP motherboards — the manufacturing model you choose directly impacts BOM flexibility, sourcing control, and volume pricing.
References
Frequently Asked Questions
Q: What are the biggest cost drivers in wireless AP BOM?
The biggest cost drivers are typically: 1) Wi-Fi SoC/Chipset (20-30%), 2) RF Front-End components (15-25%), 3) PCB (10-20%), and 4) Memory (8-15%). Focusing optimization efforts on these areas yields the highest returns.
Q: How much can I realistically reduce BOM costs?
Typical cost reduction ranges from 10-25% depending on the starting point and product maturity. New products with aggressive cost targets can achieve higher reductions. Mature products may see 5-10% through continuous improvement.
Q: Should I always choose the lowest-cost component?
No. The lowest-cost component may have higher long-term costs due to reliability issues, shorter lifespan, or supply chain instability. Consider total cost of ownership (TCO), including warranty, support, and replacement costs.


